.jpg)
Get data-driven insight to identify improvement opportunities, optimize asset performance, and make more informed decisions for your power plant.
Whether from competitors, consumers, or shareholders pressure to improve and deliver top power plant asset performance is constant, with multiple variables and trade-offs involved in optimizing asset performance. Solomon’s Worldwide Power Generation Performance Analysis (Power Study) identifies these variables/tradeoffs and compares your plant’s performance to peers, regardless of technology, fuel type, or utilization, to identify where you stand and where performance gaps exist.
The Power Study stands apart from traditional benchmarking by incorporating non-public data and proprietary Comparative Performance Analysis™ (CPA™) methodologies, key performance indicators (KPIs), and analytics to enable better decision-making and asset optimization.
eBook: Power Generation Insight for Leaders, Technicians & Analysts

Companies that regularly participate in Solomon’s Power Study achieve better-than-average performance, with 1.5 million USD per year per 100 MW in estimated annual savings.
The new Power Study adds an increased emphasis on Environmental, Social, and Governance (ESG) and sustainability, including energy efficiency and water usage metrics.
- Energy Intensity Index (EII®) – new and patented Solomon approach for normalizing energy efficiency drivers to isolate controllable versus uncontrollable losses. EII can also identify variations in heat rate (for electric-only producers) and thermal efficiency (for cogenerators) performance, holding constant for site, equipment design, and customer/grid dispatch need.
- Water Usage - important dimension of ESG and sustainability.
- Industrial Safety Risk Analysis –expanded to analyze ESG information to obtain a better perspective on how personnel safety performance relates to other business indicators, such as spending levels, plant technical reliability performance, and other similar business management parameters.
Managing operations and maintenance (O&M) expense is a critical component to ensure a power plant’s competitive position within the market. Solomon’s patented Equivalent Generation Complexity (EGC®) cost normalization compares O&M “spending efficiency” across technology and fuel types, over the entire fleet of plants. Are you over-spending or underspending in O&M, or is your spending balanced? Is your asset spending level achieving your reliability, availability, and market performance objectives? Is the allocation of resources consistent to the performance priorities you need from each generating unit in your fleet of assets?
Solomon’s Power Study has identified top-ranked performers are not uniformly excellent; most business decisions involve trade-offs. To facilitate better decision making, the study subscribes to a “pacesetter” concept, a balanced performance standard that recognizes interrelationships in performance data, and identifies performance gap closure trade-offs in availability, operating costs, and efficiency for further optimization of any given asset.


Each asset participating in the Power Study is ranked in efficiency, availability, reliability, sustainability, and operating cost. Top ranked assets are peer group ‘pacesetters’ used in a gap analysis that determines not only where, but why gaps occur in a facility relative to pacesetters. The expected benefits are quantified based on resources and priorities to justify and pursue specific improvement opportunities.
Why Participate?
- Compare with industry trends and identify improvement opportunities
- Focus budget attention on problem areas
- Determine frequency of recurring events
- Quantify lost revenue
- Assess and manage risk
- Adjust plant performance targets
- Identify resource reallocation opportunities
- Optimize individual asset and total fleet performance
Study Deliverables
Study recipients receive the following:
- Executive summary presentation with actionable insight supported by study data.
- Workbook files including validated input, study data, client tables, master events “lost revenue opportunity,” start reliability analysis, and trend data.
- Workshop covering how your team can review and use the data analyses delivered.
Metrics that Support Risk Management & Asset Optimization
Energy companies need to deliver top asset performance. There is no substitute in asset management systems for high-quality consistent data to measure and identify gap closure opportunities. Managing a power plant requires careful consideration of many variables and trade-offs. How does one go about optimizing their assets?
- EGC – a patented Solomon indicator for normalizing installed equipment impacts, age-related impacts, utilization-related impacts, etc., all of which are cost-drivers between various block configurations.
- EII – a patented Solomon indicator for normalizing energy efficiency drivers to isolate controllable versus uncontrollable losses.
Frequently Asked Questions (FAQ)
A: The Solomon Power Study provides a proven, data-driven methodology, combined with experienced power industry professionals, to assess KPI gaps and underlying causes for identification, quantification, and realistic gap closure improvement opportunities.
A: Optimization implies a complete, comprehensive foundation of monitored and analyzed data to achieve asset performance goals by managing inputs (such as financial and human resources), and adjusting plans for evolving circumstances, to optimize the production or outputs of the assets (commercial execution) efficiently. The data analyses consider risk, resource utilization, and integrated programs that connect strategic and tactical activities which support getting the most from your assets.
A: Each year, participants contribute technical, financial, personnel, reliability, and availability data to Solomon for comparative analysis to industry peers. Through participant provided data, Solomon updates evolving trends. The data represents how power generation asset owners tactically respond to ongoing evolution in the electric market demands, competitive forces, and policy and regulatory decisions. Solomon converts this confidential participant data into peer groups for comparison and performance gaps calculations.
A: Standard power industry technical indicators and cost indicators are the first level of comparison data used. Using the standard indicators is helpful, but some of those indicators can introduce distortions from ‘economies of scale’, or ‘economies of utilization’ among other reasons. Solomon has gone beyond standard industry performance metrics and developed its own proprietary indicators that give a broader perspective and more accurate performance comparisons, allowing for quantified, focused performance improvements. Finally, the patented Solomon normalization methods and performance indicators quantify important cost-drivers (technology levels, age, etc.) in operations and maintenance spending, efficiency-drivers, and human resource utilization drivers, to manage cogeneration asset comparisons.
.jpg)
Learn How You Can Participate
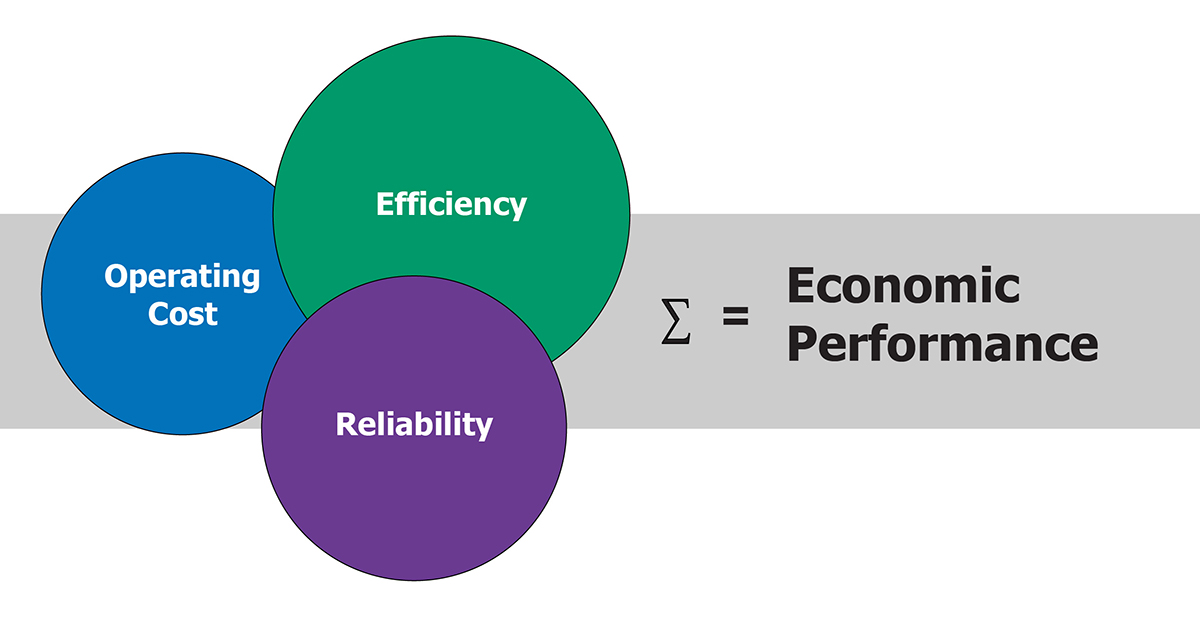
Participating in the Power Study finds connections between technical performance, financial spending, and commercial revenue capture data that are critical to ensure the success of your power plant. Effective powerplant practices can help generating units and blocks achieve their unit market mission by successfully optimizing the economic performance of any given asset area. Join the Power Study today and create your roadmap to effectively manage resources, identify performance gap closure opportunities, make better decisions, enhance your competitiveness, and optimize asset performance.
Data Quality, Benchmarking Methodology
A Foundation for Effective Comparative Performance Analysis and Decision Support
We prioritize the integrity and confidentiality of participant-submitted data and rigorously review that data before benchmarking begins. Then, we employ our normalization process and benchmarking methodology to provide valuable and trusted peer group comparisons that deliver meaningful KPIs. Finally, our staff of senior consultants apply their deep industry experience to develop practical insight and recommendations to enable your success.
.jpg)
.jpg)
.jpg)
.jpg)
.jpg)
.jpg)
.jpg)


.jpg)
.jpg)
.jpg)
.jpg)
.jpg)
.jpg)
.jpg)